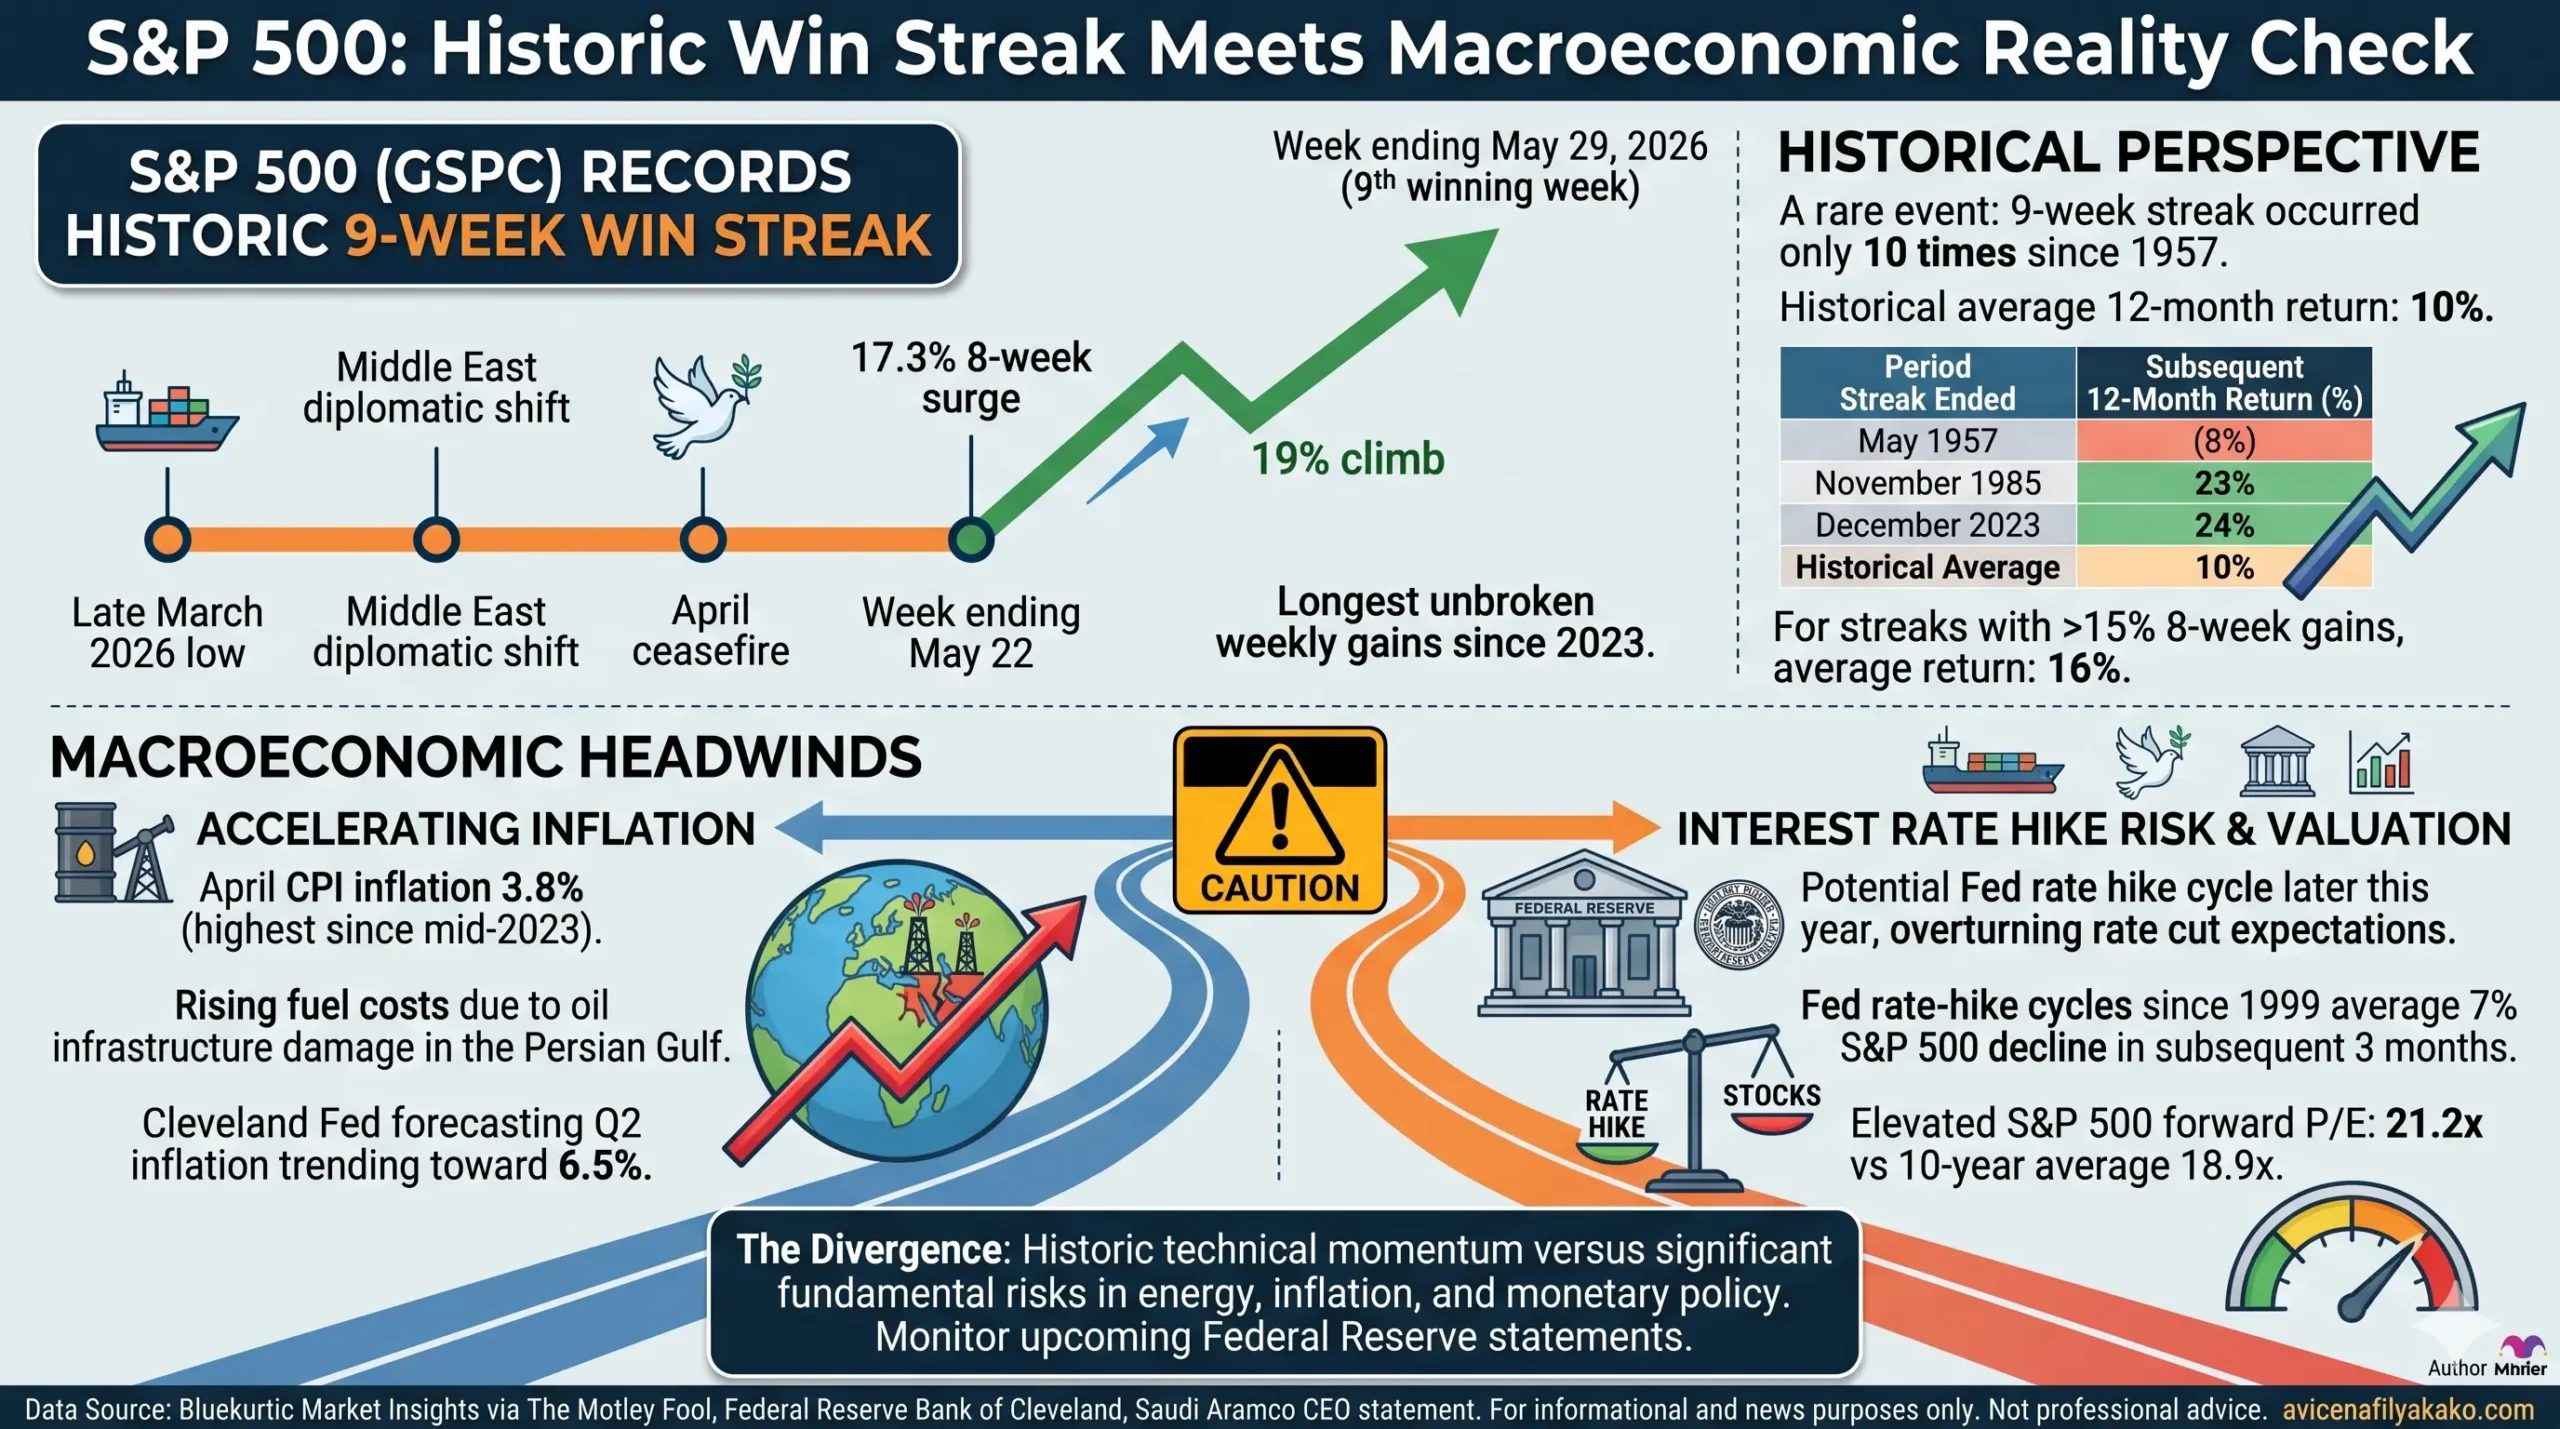
The S&P 500 (^GSPC) concluded a historic nine-week win streak on the week ending May 29, 2026, marking its longest uninterrupted stretch of weekly gains since 2023. Driven by a sharp relief rally following a diplomatic ceasefire in the Middle East, the index surged 19% from its late-March low point.
This technical milestone places the current market in rare historical territory. However, a deeper look at underlying macroeconomic indicators reveals a stark disconnect between positive price momentum and escalating inflationary pressures that could disrupt equity valuations.
Historically, prolonged weekly winning streaks signal sustained upward momentum for corporate equities. According to data from Bluekurtic Market Insights published by The Motley Fool, the S&P 500 has logged a nine-week winning streak only 10 other times since the index was established in its modern form in 1957.
Historical performance data demonstrates that after achieving a nine-week win streak, the index has gone on to post an average 12-month return of 10%.
The Geopolitical Catalyst and Historical Precedent
The market’s trajectory shifted violently over the first half of 2026. Investor panic spiked in late February when a U.S. military engagement with Iran sent shockwaves through global commodities markets. Drones and missiles disrupted critical commercial shipping lanes across the Strait of Hormuz, precipitating an 8% drop in the S&P 500 over the ensuing month due to what energy analysts recorded as the largest single oil supply disruption in history.
Equities recovered when President Donald Trump adopted a diplomatic approach in late March, culminating in an official ceasefire in early April. The sudden de-escalation triggered an aggressive relief rally. Over the eight-week period ending May 22, the S&P 500 surged 17.3%—ranking as the second-best eight-week rally in the history of the index.
Historical S&P 500 Performance Post 9-Week Win Streak
| Period Streak Ended | Subsequent 12-Month Return (%) |
|---|---|
| May 1957 | (8%) |
| November 1985 | 23% |
| December 2023 | 24% |
| Historical Average | 10% |
Data Source: Bluekurtic Market Insights via The Motley Fool
When looking at specific historical sub-sets where an eight-week gain exceeded 15%, forward 12-month returns averaged 16%. Based purely on these technical calculations, the index would project toward a level of 8,669 by mid-2027.
The Macroeconomic Reality Check
In my analysis, relying purely on historical technical patterns ignores highly volatile fundamental risks currently developing under the market’s surface. The recent rally reflects relief that a war was averted, but it fails to account for the persistent physical damage inflicted on energy infrastructure across the Persian Gulf.
Speaking on market normalization timelines, Amin Nasser, CEO of Saudi Aramco, stated that disruptions to global energy supplies and infrastructure recovery may persist until 2027. This structural bottleneck is already feeding directly into domestic economic metrics.
- Accelerating Inflation: Elevated fuel costs pushed the April Consumer Price Index (CPI) inflation rate up to 3.8%, the highest reading seen since mid-2023.
- Worse Ahead: A forecasting model from the Federal Reserve Bank of Cleveland indicates that CPI inflation is currently trending toward 6.5% for the second quarter of 2026.
- The Rate Hike Risk: This inflation surge introduces the distinct possibility that the Federal Reserve may be forced to initiate an interest rate hike cycle later this year—a scenario completely at odds with the rate cuts investors anticipated just months ago.
The broader risk stems from current stock valuations. The S&P 500 is currently trading at a forward earnings multiple of 21.2 times, representing a stark premium against its long-term 10-year forward average of 18.9 times.
Historical monetary data since 1999 shows that across the Federal Reserve’s last four distinct rate-hike cycles, the S&P 500 declined during the immediate three months following the first hike, averaging a 7% drop. With equity multiples already stretched, a sudden pivot from anticipated rate cuts to active monetary tightening could trigger a sharp valuation correction, overpowering the technical tailwinds of the past nine weeks. Investors implementing broader equity allocations or reviewing related index fund strategies should monitor upcoming Federal Reserve policy statements closely as the macroeconomic landscape shifts.
What You Need to Know (FAQ)
Why did the S&P 500 achieve a nine-week win streak?
The streak was driven by a sharp 19% relief rally starting in late March 2026, sparked by a diplomatic ceasefire in the Middle East that eased severe investor anxiety regarding global oil supply lines in the Strait of Hormuz.
What does history say happens after an S&P 500 nine-week winning streak?
Historical market data compiled since 1957 indicates that the S&P 500 has achieved this specific streak only 10 other times, averaging a 10% positive return over the subsequent 12-month period.
Why are analysts urging caution despite the record market rally?
Analysts point to a dangerous mix of an expensive forward price-to-earnings ratio (21.2x), rising April CPI inflation (3.8%), and a Cleveland Fed forecast pointing toward 6.5% inflation, which may force the Federal Reserve to raise interest rates instead of cutting them.
Disclaimer: This article is provided for general informational and news purposes only and should not be construed as professional advice (such as legal, medical, or financial). The author strives for accuracy and timeliness, but no representations or warranties are made regarding completeness or reliability, and details may change as a story develops. Any action you take based on this information is strictly at your own risk. Corrections or updates can be requested via the site’s contact page.