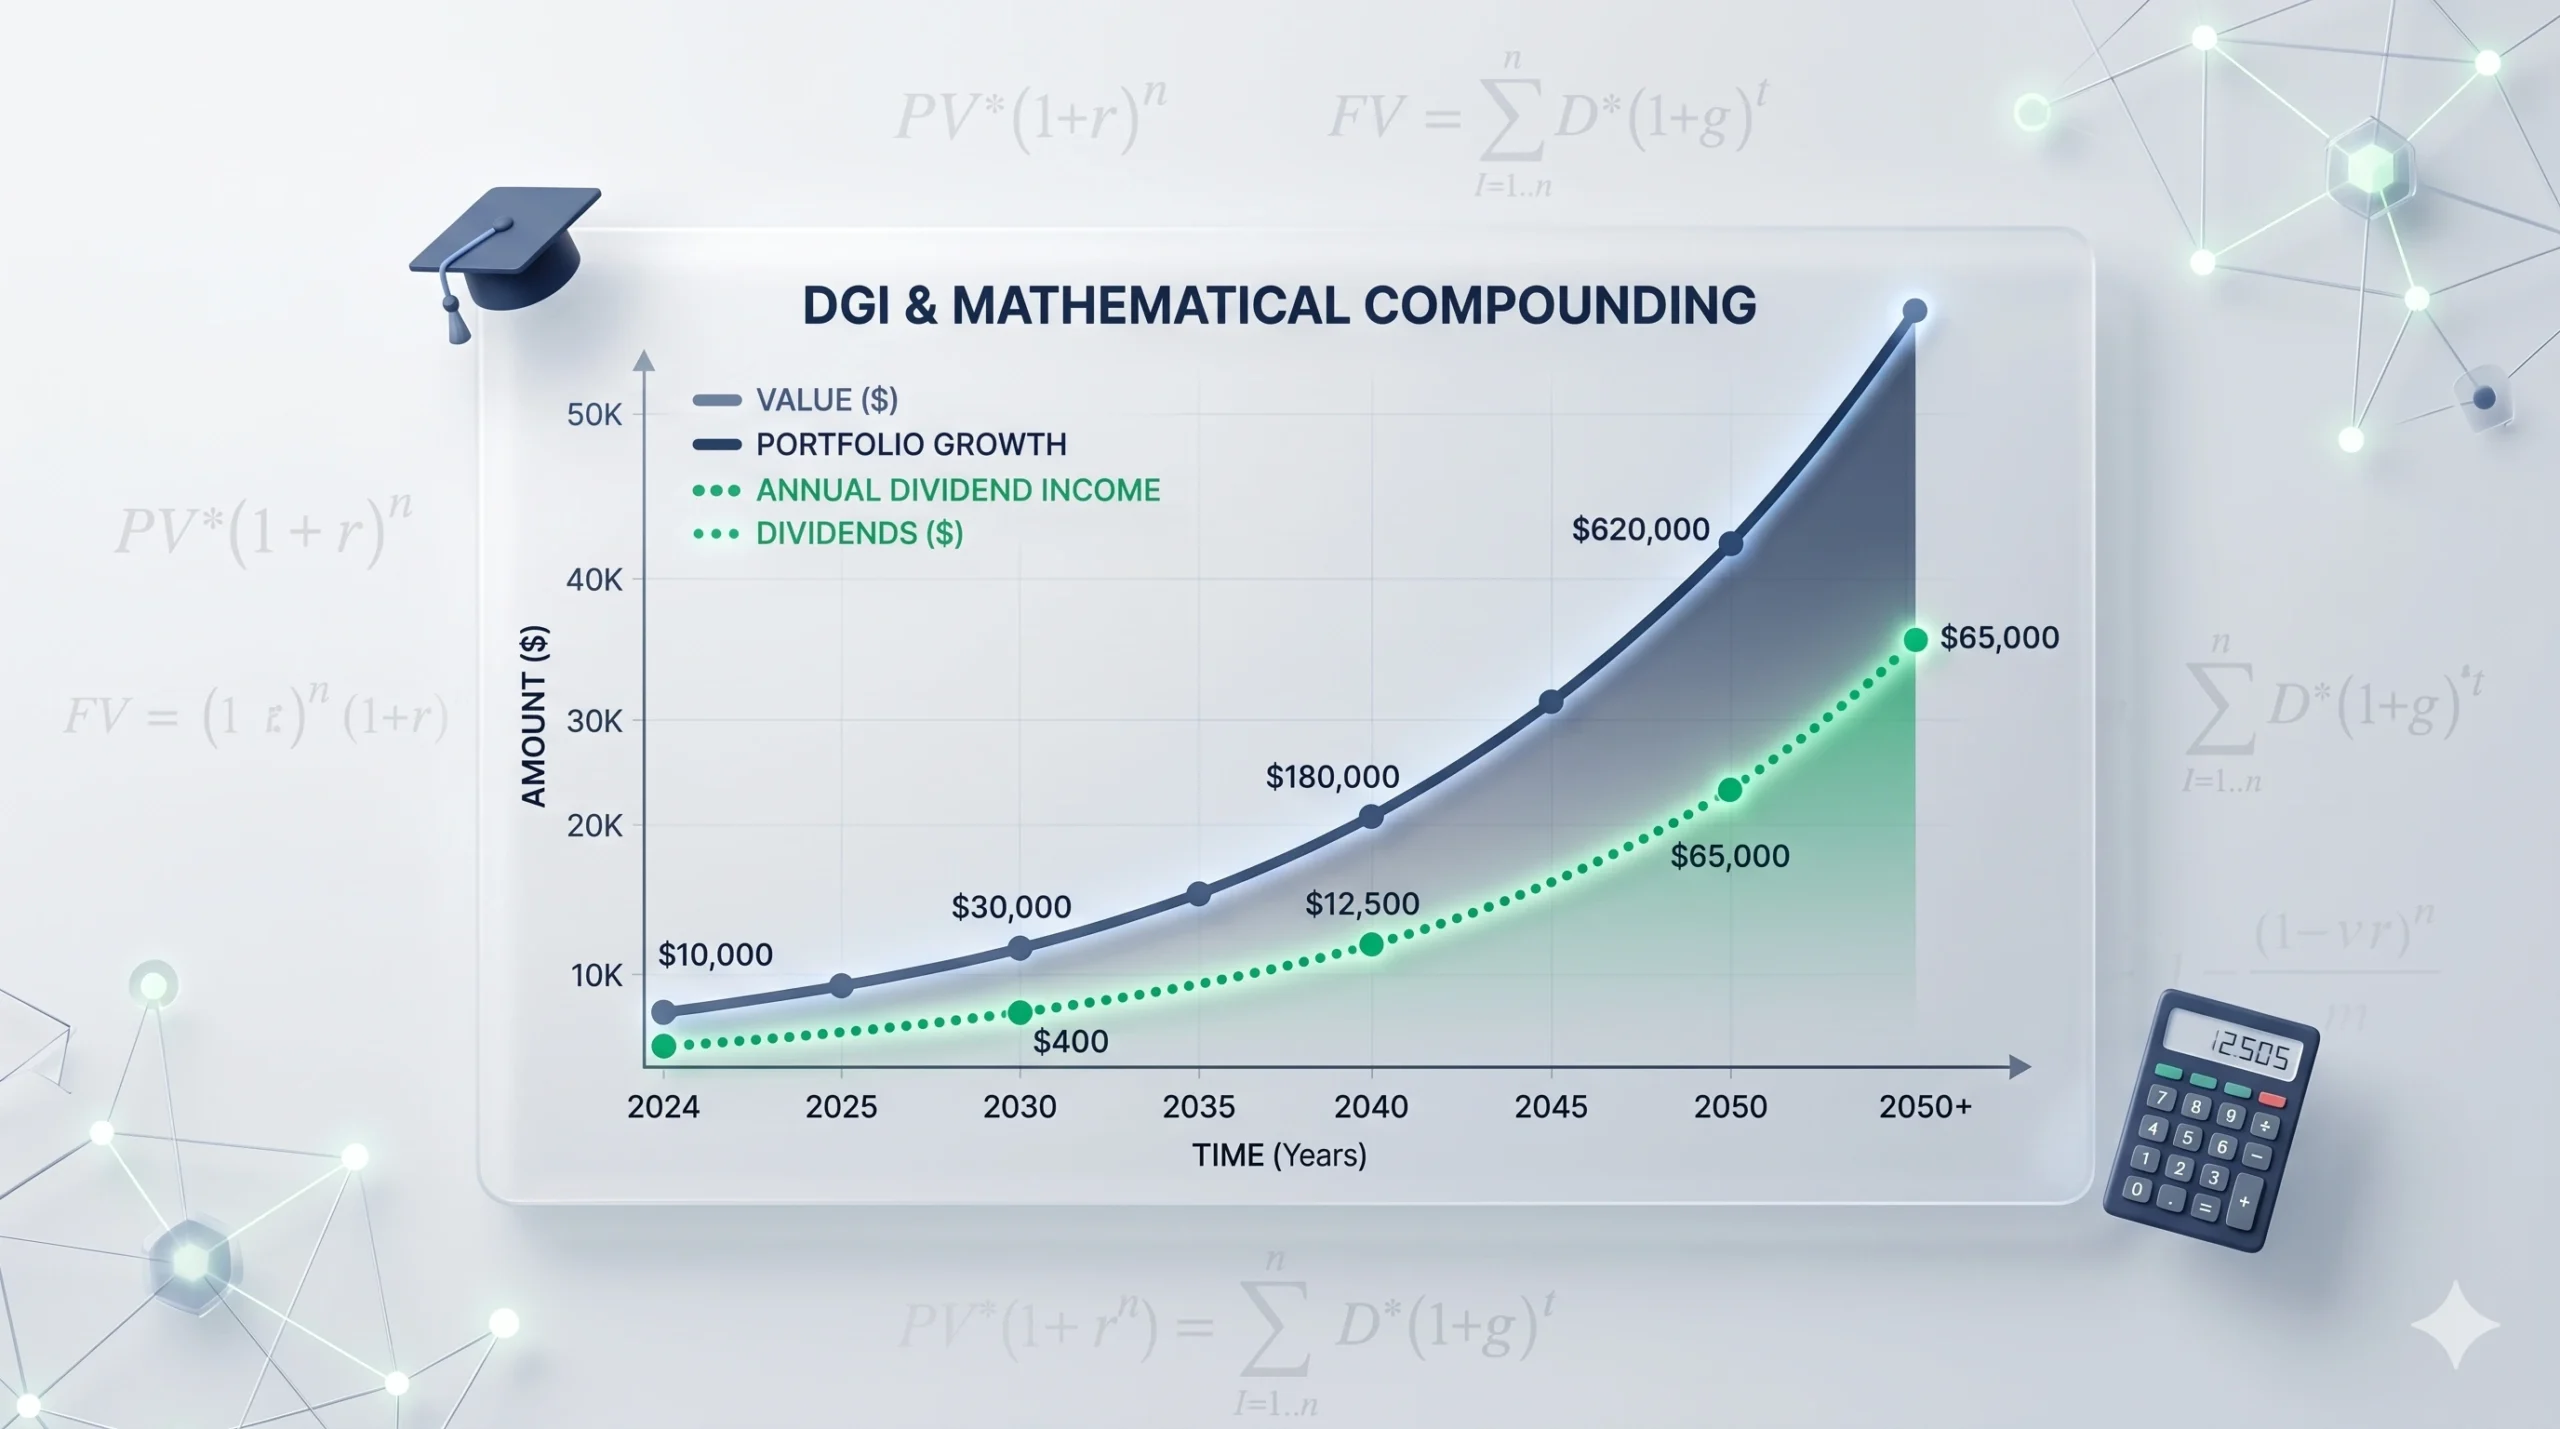
For economics and finance students, understanding the long-term impact of capital accumulation requires looking beyond static investment models. Traditional savings frameworks often overlook the exponential compounding power generated by Dividend Growth Investing (DGI) combined with a disciplined Dividend Reinvestment Plan (DRIP). When companies consistently increase their cash payouts and investors automatically use those liquid dividends to acquire more shares, the portfolio transitions from linear growth to an accelerated, self-sustaining wealth engine.
Modeling these variables early in an academic or professional career highlights how critical time horizon and growth rates are compared to sheer initial capital. This interactive simulator is designed as an open-source educational tool to help students visualize the long-term mechanics of compounding returns, showing how minor shifts in annual dividend growth can drastically alter both final portfolio valuations and recurring passive income streams over a multi-decade horizon.
Interactive Dividend Growth Investing (DGI) Calculator
An open-source modeling tool for long-term wealth and dividend forecasting.
Methodology & Mathematical Framework
To maintain academic transparency and ease of use for classroom modeling, this calculator simulates a standard continuous growth and automatic reinvestment system using the following mathematical assumptions:
- Dividend Reinvestment Plan (DRIP): The model assumes that 100% of all annual dividend distributions are immediately reinvested back into the portfolio at the end of each fiscal year to acquire additional fractional shares, compounding the principal.
- Organic Dividend Growth Rate (g): The yield generated by the asset grows annually at a constant percentage rate (g), which reflects a company consistently increasing its payout over time.
- Tax and Friction Simplification: For foundational educational modeling, this simulation assumes zero capital gains tax, zero dividend withholding tax, and no broker transaction fees.
Core Formulas Applied:
The annual dividend income (I) for any given year (t) is determined by multiplying the accumulated portfolio value (V) by the dynamically increasing dividend yield (Y):
Where the current year's yield (Yt) scales compounded annually by the dividend growth rate (g) based on the initial yield (Y0):
At the end of each compounding cycle, the portfolio value updates sequentially by absorbing the total dividend payout of that year:
This cyclical looping creates a dual-compounding curve—where both the total number of shares owned and the cash payout per share are increasing simultaneously.
Academic References
This calculator’s foundational modeling parameters align with standard long-term total return forecasting frameworks. For a deeper theoretical analysis of long-term compounding mechanics, capital accumulation curves, and dividend growth historical performance, please refer to the primary research paper:
- Kako, A. F. A. (2026). The Dividend Growth Investing Strategy: A Comprehensive Analysis. Social Science Research Network (SSRN 6669458). Available at: http://dx.doi.org/10.2139/ssrn.6669458